15. Spines and Ticks in Matplotlib
By Bernd Klein. Last modified: 24 Mar 2022.
Moving the Border Lines and Polishing up the Axes Notations

The word spine is most commonly known as the backbone or spinal cord of the human skeleton. Another meaning stands for a book's jacket. Our picture on the right side shows the spines of a cactus, artistically changed into something which looks like a ribcage. You will hardly find the usage of the word spine of matplotlib in a dictionary. Spines in matplotlib are the lines connecting the axis tick marks and noting the boundaries of the data area.
We will demonstrate in the following that the spines can be placed at arbitrary positions.
We will move around the spines in the course of this chapter so that the form a 'classical' coordinate syste. One where we have a x axis and a y axis and both go through the origin i.e. the point (0, 0)
We will show the naming of the spines in the following diagram:
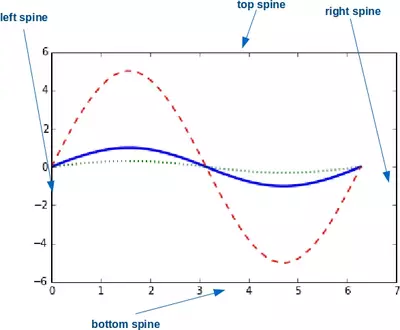
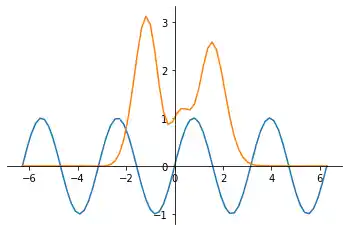
We will move the spines to build a 'classical' coordinate system. To this purpose we turn the top and right spine invisible and move the bottom and left one around:
# the next "inline" statement is only needed,
# if you are working with "ipython notebook"
%matplotlib inline

import numpy as np
import matplotlib.pyplot as plt

X = np.linspace(-2 * np.pi, 2 * np.pi, 70, endpoint=True)
F1 = np.sin(2* X)
F2 = (2*X**5 + 4*X**4 - 4.8*X**3 + 1.2*X**2 + X + 1)*np.exp(-X**2)

fig, ax = plt.subplots()

# making the top and right spine invisible:
ax.spines['top'].set_color('none')
ax.spines['right'].set_color('none')

# moving bottom spine up to y=0 position:
ax.xaxis.set_ticks_position('bottom')
ax.spines['bottom'].set_position(('data',0))

# moving left spine to the right to position x == 0:
ax.yaxis.set_ticks_position('left')
ax.spines['left'].set_position(('data',0))

ax.plot(X, F1, X, F2)

plt.show()
Live Python training

Enjoying this page? We offer live Python training courses covering the content of this site.
See our Python training courses
Customizing Ticks
Matplotlib has so far - in all our previous examples - automatically taken over the task of spacing points on the axis. We can see for example that the X axis in our previous example was numbered -6. -4, -2, 0, 2, 4, 6, whereas the Y axis was numbered -1.0, 0, 1.0, 2.0, 3.0
xticks is a method, which can be used to get or to set the current tick locations and the labels. The same is true for yticks:
import matplotlib.pyplot as plt
fig, ax = plt.subplots()

xticks = ax.get_xticks()
xticklabels = ax.get_xticklabels()
print(xticks, xticklabels)
for i in range(6):
    print(xticklabels[i])

yticks = ax.get_yticks()
print(yticks)
OUTPUT:
[0.  0.2 0.4 0.6 0.8 1. ] [Text(0, 0, ''), Text(0, 0, ''), Text(0, 0, ''), Text(0, 0, ''), Text(0, 0, ''), Text(0, 0, '')]
Text(0, 0, '')
Text(0, 0, '')
Text(0, 0, '')
Text(0, 0, '')
Text(0, 0, '')
Text(0, 0, '')
[0.  0.2 0.4 0.6 0.8 1. ]
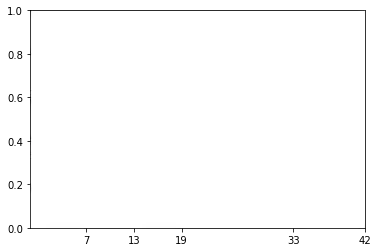
As we said before, we can also use xticks to set the location of xticks:
import matplotlib.pyplot as plt
fig, ax = plt.subplots()

ax.set_xticks([7, 13, 19, 33, 42])
OUTPUT:
[<matplotlib.axis.XTick at 0x7f4f8ffc4be0>,
 <matplotlib.axis.XTick at 0x7f4f8ffc4bb0>,
 <matplotlib.axis.XTick at 0x7f4f90033b50>,
 <matplotlib.axis.XTick at 0x7f4f8fff5220>,
 <matplotlib.axis.XTick at 0x7f4f8fff5970>]
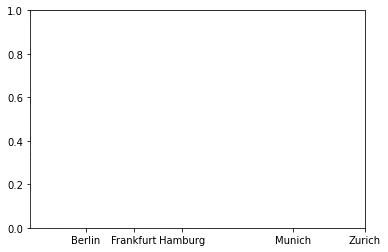
Now, we will set both the locations and the labels of the xticks:
import matplotlib.pyplot as plt
fig, ax = plt.subplots()

ax.set_xticks([7, 13, 19, 33, 42])
ax.set_xticklabels(['Berlin', 'Frankfurt', 'Hamburg', 'Munich', 'Zurich'])
OUTPUT:
[Text(7, 0, 'Berlin'),
 Text(13, 0, 'Frankfurt'),
 Text(19, 0, 'Hamburg'),
 Text(33, 0, 'Munich'),
 Text(42, 0, 'Zurich')]
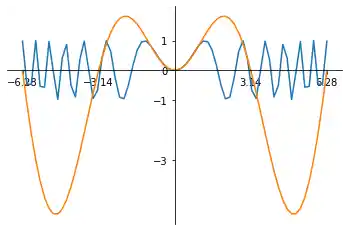
Let's get back to our previous example with the trigonometric functions. Most people might consider factors of Pi to be more appropriate for the X axis than the integer labels:
import numpy as np
import matplotlib.pyplot as plt

X = np.linspace(-2 * np.pi, 2 * np.pi, 70, endpoint=True)
X = np.linspace(-2 * np.pi, 2 * np.pi, 70, endpoint=True)
F1 = np.sin(X**2)
F2 = X * np.sin(X)

fig, ax = plt.subplots()

# making the top and right spine invisible:
ax.spines['top'].set_color('none')
ax.spines['right'].set_color('none')
# moving bottom spine up to y=0 position:
ax.xaxis.set_ticks_position('bottom')
ax.spines['bottom'].set_position(('data',0))
# moving left spine to the right to position x == 0:
ax.yaxis.set_ticks_position('left')
ax.spines['left'].set_position(('data',0))

ax.set_xticks( [-6.28, -3.14, 3.14, 6.28])
ax.set_yticks([-3, -1, 0, +1, 3])
ax.plot(X, F1)
ax.plot(X, F2)

plt.show()
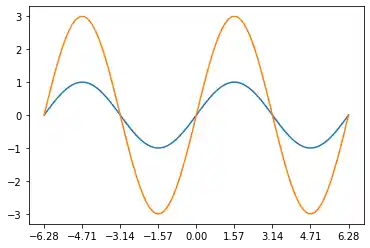
There is an easier way to set the values of the xticks so that we do not have to caculate them manually. We use plt.MultipleLocator with np.pi/2 as argument:
import numpy as np
import matplotlib.pyplot as plt

X = np.linspace(-2 * np.pi, 2 * np.pi, 100)
F1 = np.sin(X)
F2 = 3 * np.sin(X)
fig, ax = plt.subplots()

ax.xaxis.set_major_locator(plt.MultipleLocator(np.pi / 2))

ax.plot(X, F1, X, F2)

plt.show()
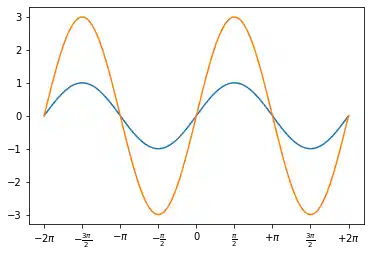
Setting Tick Labels
We want to rename the xticks now with custom markers. We will use the method xticks again for this purpose as we did in our previous examples. But this time we will call xticks with two parameters: The first one is the same list we used before, i.e. the positions on the x axis, where we want to have the ticks. The second parameter is a list of the same size with corresponding LaTeX tick marks, i.e. the text which we want to see instead of the values. The LaTeX notation has to be a raw string in most cases to suppress the escaping mechanism of Python, because the LaTeX notation heavily uses and relies on the backslash.
import numpy as np
import matplotlib.pyplot as plt
import matplotlib.ticker as ticker

X = np.linspace(-2 * np.pi, 2 * np.pi, 100)
F1 = np.sin(X)
F2 = 3 * np.sin(X)
fig, ax = plt.subplots()

positions = [np.pi / 2 * x for x in range(-4, 5)]
labels = [r'$-2\pi$', r'$-\frac{3\pi}{2}$', r'$-\pi$',
                    r'$-\frac{\pi}{2}$', 0, r'$\frac{\pi}{2}$',
                    r'$+\pi$', r'$\frac{3\pi}{2}$', r'$+2\pi$']
ax.xaxis.set_major_locator(ticker.FixedLocator(positions))
ax.xaxis.set_major_formatter(ticker.FixedFormatter(labels))


ax.plot(X, F1, X, F2)

plt.show()
Live Python training
Enjoying this page? We offer live Python training courses covering the content of this site.
Upcoming online Courses
01 Dec to 05 Dec 2025
22 Oct to 24 Oct 2025
03 Dec to 05 Dec 2025
Efficient Data Analysis with Pandas
01 Dec to 02 Dec 2025
22 Oct to 24 Oct 2025
See our Python training courses
Adjusting the ticklabels
We want to increase the legibility of the ticklabels. We will increase the font size, and we will render them on a semi transparant background.
print(ax.get_xticklabels())
OUTPUT:
[Text(-6.283185307179586, 0, '$-2\\pi$'), Text(-4.71238898038469, 0, '$-\\frac{3\\pi}{2}$'), Text(-3.141592653589793, 0, '$-\\pi$'), Text(-1.5707963267948966, 0, '$-\\frac{\\pi}{2}$'), Text(0.0, 0, '0'), Text(1.5707963267948966, 0, '$\\frac{\\pi}{2}$'), Text(3.141592653589793, 0, '$+\\pi$'), Text(4.71238898038469, 0, '$\\frac{3\\pi}{2}$'), Text(6.283185307179586, 0, '$+2\\pi$')]
for xtick in ax.get_xticklabels():
    print(xtick)
OUTPUT:
Text(-6.283185307179586, 0, '$-2\\pi$')
Text(-4.71238898038469, 0, '$-\\frac{3\\pi}{2}$')
Text(-3.141592653589793, 0, '$-\\pi$')
Text(-1.5707963267948966, 0, '$-\\frac{\\pi}{2}$')
Text(0.0, 0, '0')
Text(1.5707963267948966, 0, '$\\frac{\\pi}{2}$')
Text(3.141592653589793, 0, '$+\\pi$')
Text(4.71238898038469, 0, '$\\frac{3\\pi}{2}$')
Text(6.283185307179586, 0, '$+2\\pi$')
labels = [xtick.get_text() for xtick in ax.get_xticklabels()]
print(labels)
OUTPUT:
['$-2\\pi$', '$-\\frac{3\\pi}{2}$', '$-\\pi$', '$-\\frac{\\pi}{2}$', '0', '$\\frac{\\pi}{2}$', '$+\\pi$', '$\\frac{3\\pi}{2}$', '$+2\\pi$']
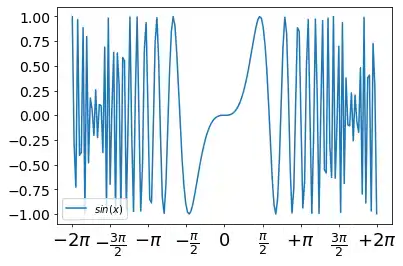
Let's increase the fontsize and make the font semi transparant:
import numpy as np
import matplotlib.pyplot as plt

X = np.linspace(-2 * np.pi, 2 * np.pi, 170, endpoint=True)
F1 = np.sin(X**3 / 2)

fig, ax = plt.subplots()

positions = [np.pi / 2 * x for x in range(-4, 5)]
labels = [r'$-2\pi$', r'$-\frac{3\pi}{2}$', r'$-\pi$',
                    r'$-\frac{\pi}{2}$', 0, r'$\frac{\pi}{2}$',
                    r'$+\pi$', r'$\frac{3\pi}{2}$', r'$+2\pi$']
ax.xaxis.set_major_locator(ticker.FixedLocator(positions))
ax.xaxis.set_major_formatter(ticker.FixedFormatter(labels))


for xtick in ax.get_xticklabels():
    xtick.set_fontsize(18)
    xtick.set_bbox(dict(facecolor='white', edgecolor='None', alpha=0.7 ))

for ytick in ax.get_yticklabels():
    ytick.set_fontsize(14)
    ytick.set_bbox(dict(facecolor='white', edgecolor='None', alpha=0.7 ))

ax.plot(X, F1, label="$sin(x)$")

ax.legend(loc='lower left')

plt.show()
Live Python training
Enjoying this page? We offer live Python training courses covering the content of this site.
Upcoming online Courses
01 Dec to 05 Dec 2025
22 Oct to 24 Oct 2025
03 Dec to 05 Dec 2025
Efficient Data Analysis with Pandas
01 Dec to 02 Dec 2025
22 Oct to 24 Oct 2025
See our Python training courses